Prior to discussing how to calculate beta in excel, lets define it. Beta is a measure of a stock’s volatility in relation to the overall market.
The beta for a stock describes how much the stock’s price moves in relation to the market. It’s generally used as both a measure of systematic risk and a performance measure. A higher beta indicates that the stock is riskier, and a lower beta indicates that the stock is less volatile than the market.
Beta, which has a value of 1, indicates that it exactly moves following the market value.
Formula to Calculate Beta in Excel.
- Download historical security prices for the asset whose beta you want to measure.
- Download historical security prices for the comparison benchmark.
- Then calculate the percent change period to period for both the asset and the benchmark.
- Find the variance of the benchmark using =VAR.
- Find the covariance of asset to the benchmark using =COVARIANCE.S
β = Covar(rs , rm)/Var rm
Example:
Suppose your data in an excel spreadsheet is as follows.
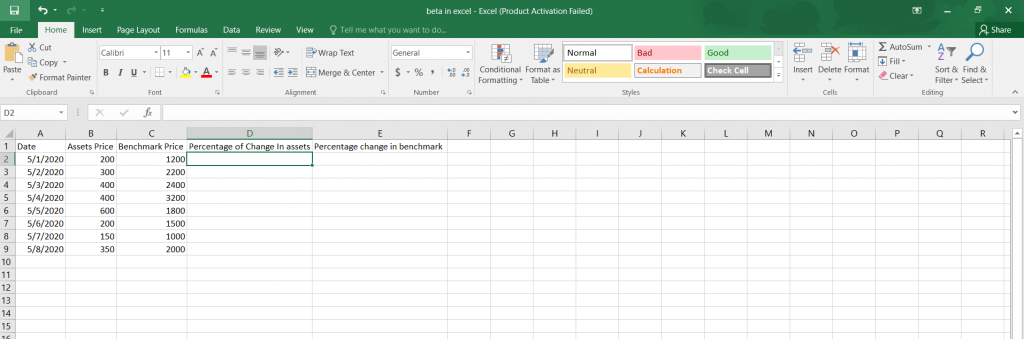
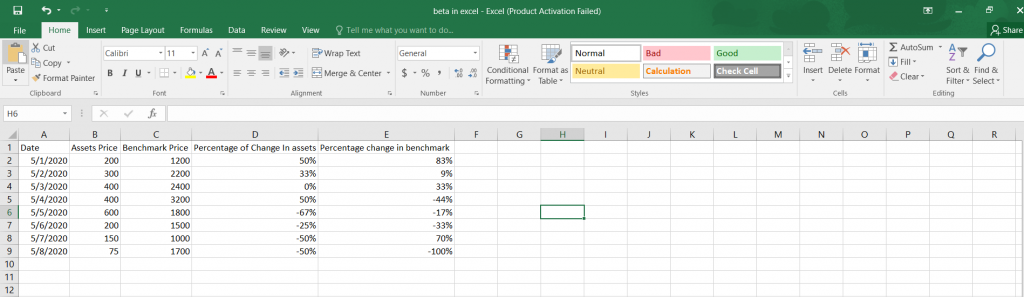
We will then calculate the percentage change in assets and the benchmark price.
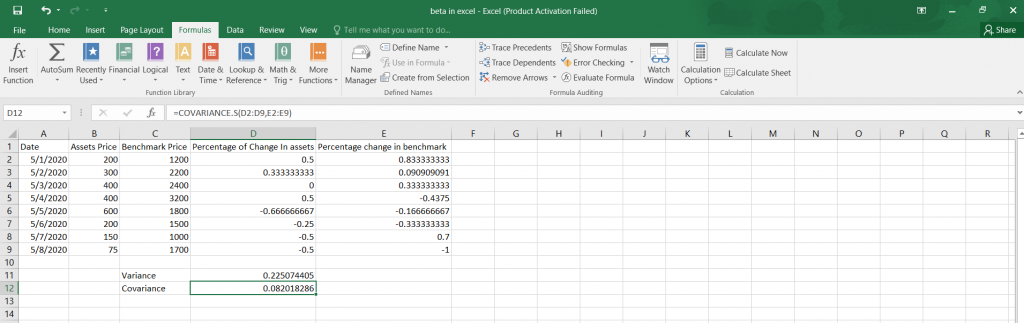
- Find the variance of the percentage change in assets using the variance function VAR.S.
- Then find the covariance of the percentage change in benchmark using the covariance function COVARIANCE.S.
Then divide the covariance by the variance to get the beta.
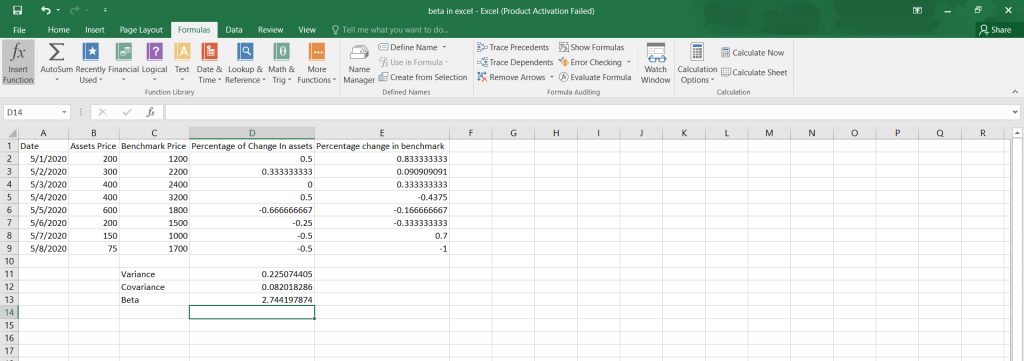
Therefore, the beta is 2.744197874.

